How BMI for Children and Teens Differs from Adults
The Body Mass Index (BMI) is a numerical value derived from a person's weight and height. While the calculation method is identical for all age groups, the interpretation changes significantly after age 20. Adult BMI categories rely on fixed numerical ranges. A BMI of 25 means the exact same thing for a 25-year-old and a 50-year-old [1].
Children and teenagers are constantly growing. Their body fat levels change naturally as they develop. Because of this, a single BMI number cannot be used to categorize a child's weight status. Instead, healthcare providers use BMI percentiles. These percentiles compare a child's BMI to other children of the same age and sex [1].
Why Age and Sex Matter
Body composition differs between boys and girls, and these differences become more pronounced during puberty. Girls typically develop higher body fat percentages than boys. Growth spurts also happen at different times and rates for each sex. The Centers for Disease Control and Prevention (CDC) uses separate growth charts for boys and girls to account for these biological differences [2].
Age is equally important. A BMI of 20 might indicate a healthy weight for a 15-year-old boy, but it could place a 5-year-old boy in the overweight category. The Kids BMI Calculator accounts for these variables by calculating the exact percentile based on the child's specific age in years and months, alongside their biological sex.
Understanding BMI Percentiles vs. Raw BMI Numbers
When you use a child BMI calculator, the raw BMI number is only the first step. The calculator takes that number and plots it on a standardized growth chart. The resulting percentile indicates how the child compares to a national reference population. If a 10-year-old boy is in the 75th percentile for BMI, it means his BMI is higher than 75% of 10-year-old boys in the reference group [1].
This percentile system provides a much more accurate picture of a child's growth trajectory than a raw number alone. It allows pediatricians to track whether a child is growing at a consistent and healthy rate over time.
Kids BMI Formula: How to Calculate BMI for Children
The mathematical formula for children is identical to the formula used for adults. The calculator handles the math automatically, but understanding the process helps verify your child's measurements. The calculation requires only weight and height.
The BMI Formula
The factor 703 in the imperial formula converts the result to match the metric calculation.
Step-by-Step Example (Metric)
For a 10-year-old child weighing 35 kg with a height of 140 cm:
📝 Step-by-Step Example (Imperial)
For a child weighing 77 lb with a height of 4'7" (55 inches):
Why the Formula Is the Same But Interpretation Differs
Once the raw BMI of 17.86 is calculated, the tool compares it against the CDC growth charts for a 10-year-old. In this example, a BMI of 17.86 for a 10-year-old boy falls roughly around the 50th percentile, indicating a healthy weight. If that exact same BMI of 17.86 belonged to a 5-year-old boy, it would place him above the 95th percentile, indicating obesity [2]. The math never changes, but the clinical meaning shifts entirely based on age and sex.
Methodology: How This Calculator Computes Percentiles
The Data Source
This calculator uses the Lambda-Mu-Sigma (LMS) method, the same statistical approach employed by the Centers for Disease Control and Prevention (CDC) to construct official growth charts. The LMS method accounts for the skewed distribution of BMI values at different ages by applying three parameters: Lambda (L) for skewness, Mu (M) for the median, and Sigma (S) for the coefficient of variation [2].
The Variables
When you enter your child's measurements, the calculator first computes the raw BMI using the standard formula. It then retrieves the precise LMS values for that exact age in months and biological sex from the CDC reference dataset. Using these parameters, it calculates a Z-score that indicates how many standard deviations your child's BMI falls from the median of the reference population.
The Output
Finally, the Z-score is converted into a percentile rank. This percentile represents where your child stands compared to a national sample of children the same age and sex. For example, a child at the 75th percentile has a higher BMI than 75% of children in the reference group. This methodology ensures that the results are clinically meaningful and align with the assessments pediatricians use during well-child visits.
Z-Scores: The Statistical Foundation
Behind every percentile is a Z-Score, a statistical measurement that indicates how many standard deviations a child's BMI falls from the mean (average) of the reference population. While percentiles are more intuitive for parents, Z-Scores are the preferred metric among pediatricians and researchers because they provide a precise, continuous measure of relative position [2].
A Z-Score of 0 means the child's BMI is exactly at the 50th percentile—the median of the reference group. A Z-Score of +1.0 indicates the BMI is one standard deviation above the mean, placing the child around the 84th percentile. Conversely, a Z-Score of -1.0 means the BMI is one standard deviation below the mean, corresponding to approximately the 16th percentile.
Z-Scores are particularly valuable for tracking growth over time and for statistical research. Unlike percentiles, which compress at the extremes (the difference between the 95th and 97th percentile is smaller than between the 50th and 52nd), Z-Scores maintain equal intervals across the entire distribution. This makes them ideal for identifying severe obesity, defined clinically as a BMI Z-Score greater than +2.0 (above the 97.7th percentile) or +3.0 (above the 99.9th percentile) [3].
How to Use the Kids BMI Calculator
Getting an accurate result requires precise measurements. Follow these steps to ensure the calculator provides the most reliable percentile for your child.
Entering Measurements Accurately
- Age: Enter the exact age in years and months, or use the Date of Birth feature. Even a few months can shift a younger child's percentile significantly.
- Sex: Select the biological sex assigned at birth. The CDC growth charts are strictly separated by sex due to different developmental patterns.
- Height: Measure your child without shoes. Use a flat surface and a book to press down flat on the hair for an accurate standing height.
- Weight: Weigh your child in the morning, after using the restroom, and wearing only light clothing. Place the scale on a hard, flat surface.
Interpreting Your Child's Percentile Result
After entering the data, the tool will display the raw BMI, the exact percentile, and the corresponding weight category. It also calculates the healthy weight range for your child's current height. Remember that the healthy weight range is broad. A child can be at the 10th percentile or the 80th percentile and both be considered perfectly healthy [1].
CDC BMI-for-Age Growth Charts
The CDC growth charts are the standard tool used by pediatricians across the United States to monitor the physical growth of children. These charts are based on national survey data and are updated periodically to reflect the current population.
Boys BMI Percentile Chart (2 to 20 Years)
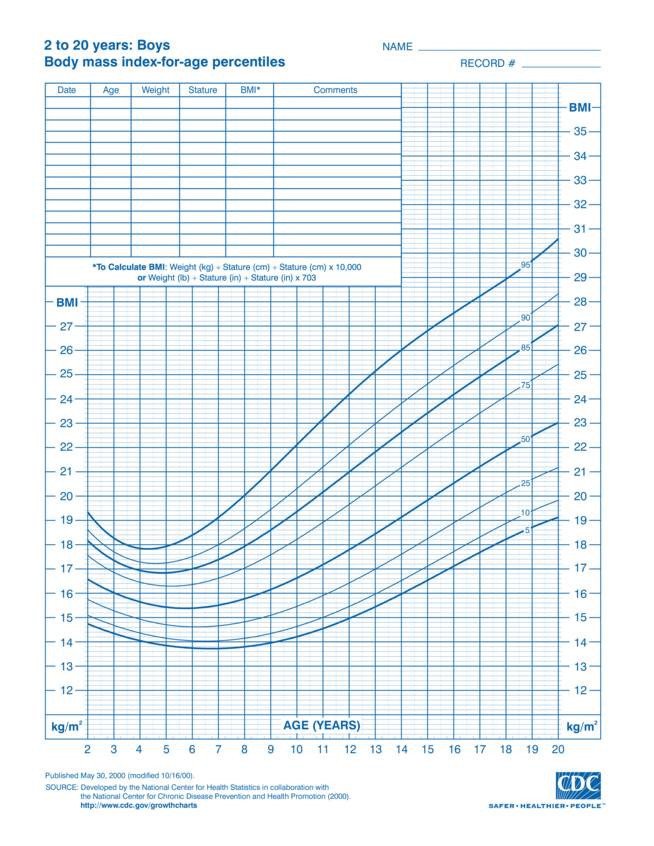
Source: Centers for Disease Control and Prevention (CDC) - Boys BMI-for-Age Percentiles
The boys' chart tracks BMI from age 2 through age 20. The curved lines represent specific percentiles, including the 5th, 10th, 25th, 50th, 75th, 85th, 90th, and 95th. The 50th percentile line represents the median, meaning half of the reference population falls above it and half falls below it.
Girls BMI Percentile Chart (2 to 20 Years)
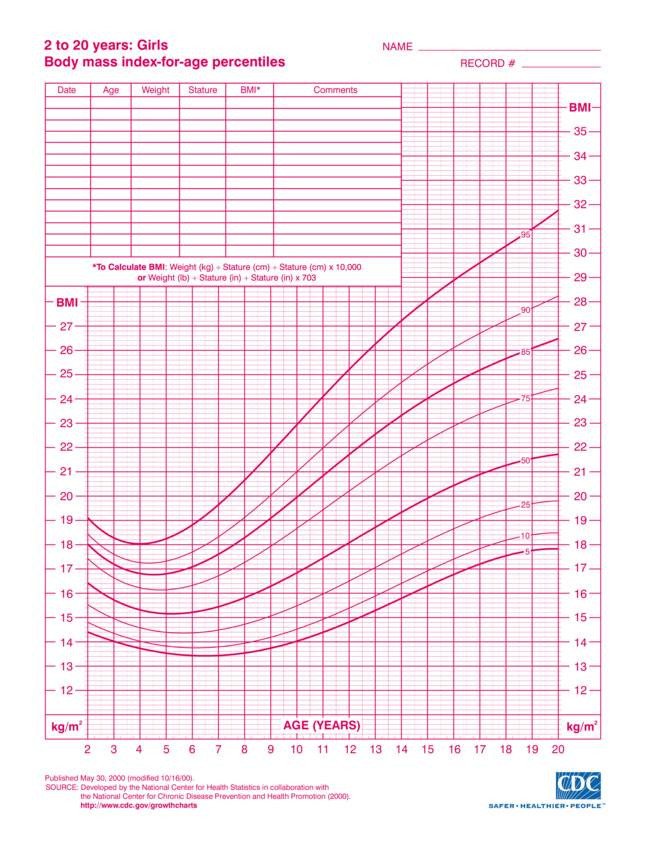
Source: Centers for Disease Control and Prevention (CDC) - Girls BMI-for-Age Percentiles
The girls' chart follows the same structure but features different curves. Girls generally experience their growth spurt earlier than boys, which is reflected in the steeper rise of the BMI curves during early adolescence. Comparing a girl's BMI to the boys' chart would result in an inaccurate assessment.
How to Read a CDC Growth Chart
To read the chart manually, locate the child's age on the horizontal X-axis. Draw a vertical line up from that age. Next, locate the child's BMI on the vertical Y-axis and draw a horizontal line across. The point where the two lines intersect is the child's data point. The curved line closest to that point indicates the percentile.
BMI Percentile Categories for Kids
Health organizations use standardized percentile ranges to classify the weight status of children and teens. These categories help pediatricians identify potential health risks early and guide discussions with parents [1].
| Weight Status | Percentile Range | Description |
|---|---|---|
| Underweight | < 5th percentile | Lower than the majority of peers. May indicate inadequate nutrition or underlying health issues. |
| Healthy Weight | 5th to < 85th percentile | Within the expected range for age and sex. Associated with the lowest health risks. |
| Overweight | 85th to < 95th percentile | Above the expected range. Indicates a need for monitoring and potential lifestyle adjustments. |
| Obesity | ≥ 95th percentile | Significantly above the expected range. Carries a higher risk for immediate and long-term health complications. |
Some pediatricians further categorize severe obesity as a BMI at or above 120% of the 95th percentile, or a BMI of 35 or higher, whichever is lower. This classification helps identify children who may need intensive medical intervention [3].
Health Implications of Childhood BMI
Childhood weight status affects both immediate health and long-term outcomes. The American Academy of Pediatrics emphasizes that addressing weight early can prevent chronic diseases from developing in adulthood.
Physical Health Considerations
Children with a BMI in the overweight or obesity categories face several physical health risks. Excess weight puts additional stress on developing bones and joints, often leading to orthopedic issues like flat feet or knee pain [4].
- Type 2 Diabetes: Once considered an adult disease, type 2 diabetes is increasingly diagnosed in children with obesity due to insulin resistance.
- Cardiovascular Risk: High BMI in childhood is linked to high blood pressure and elevated cholesterol levels, which are early markers for heart disease.
- Sleep Apnea: Excess tissue around the neck can obstruct airways during sleep, leading to poor sleep quality and daytime fatigue.
- Asthma: Children with a higher BMI are more likely to develop asthma and experience more severe symptoms.
Conversely, children in the underweight category may face nutritional deficiencies, delayed growth, and weakened immune systems. Ensuring adequate caloric and nutrient intake is vital for their development.
Psychological and Social Considerations
The psychological impact of weight status is profound. Children with obesity frequently experience weight stigma, bullying, and social isolation. This can lead to poor self-esteem, anxiety, and depression. It can also trigger disordered eating patterns as they attempt to manage their weight [3]. Creating a supportive, non-judgmental environment at home is a protective factor for mental health.
Factors Affecting Children's BMI
A child's BMI is the result of a complex interaction between genetics, environment, and behavior. Understanding these factors helps families make sustainable, healthy changes.
Genetics and Family History
Genetics play a significant role in how a child's body stores fat and regulates appetite. If a child's parents have a history of obesity, the child has a higher genetic predisposition to weight gain. However, genetics is not destiny. A healthy environment can mitigate genetic risks.
Diet and Nutrition
The modern food environment heavily features ultra-processed foods and sugar-sweetened beverages. These items are calorie-dense but nutrient-poor, making it easy for children to consume excess calories without feeling full. The USDA Dietary Guidelines recommend focusing on whole grains, lean proteins, fruits, and vegetables while limiting added sugars and saturated fats [5].
Physical Activity and Screen Time
The CDC recommends that children and adolescents get at least 60 minutes of moderate-to-vigorous physical activity every day. This includes aerobic exercises, muscle-strengthening activities, and bone-strengthening exercises [6]. Conversely, excessive screen time is strongly correlated with higher BMI. Sedentary behavior reduces calorie expenditure and is often accompanied by mindless snacking.
Sleep and Stress
Sleep deprivation disrupts the hormones that regulate hunger, specifically ghrelin and leptin. Children who do not get enough sleep tend to feel hungrier and crave high-calorie foods. Age-appropriate sleep is vital. School-age children need 9 to 12 hours per night, while teenagers need 8 to 10 hours [7].
When BMI May Not Be Accurate for Children
While BMI is an excellent population-level screening tool, it has limitations at the individual level. Pediatricians consider several factors before making clinical decisions based solely on a child's BMI percentile.
The Impact of Puberty and Growth Spurts
Puberty causes rapid changes in height, weight, and body composition. A child might experience a sudden spike in height before their weight catches up, temporarily dropping their BMI percentile. Conversely, normal pubertal weight gain can temporarily push a child into a higher percentile. Pediatricians look at the long-term growth trend rather than a single measurement during these transitional years.
Athletic and Muscular Children
BMI does not differentiate between fat mass and lean muscle mass. A child who plays competitive sports, such as football or gymnastics, may have a high BMI due to increased muscle density. In these cases, a pediatrician might use waist circumference or body fat calipers to get a more accurate assessment of the child's health [8].
Children with Disabilities or Chronic Conditions
Children with certain physical disabilities may have reduced muscle mass or limited mobility, which alters normal growth patterns. Additionally, some medical conditions and the medications used to treat them can cause significant weight fluctuations. Standard growth charts may not be appropriate for these children, and specialized tracking is required.
Healthy Habits for Children and Teens
Fostering healthy habits is more effective than focusing on the number on the scale. The American Academy of Pediatrics recommends the "5-2-1-0" daily framework for healthy childhood development [3].
- 5: Five or more servings of fruits and vegetables per day.
- 2: Two hours or less of recreational screen time per day.
- 1: One hour or more of physical activity per day.
- 0: Zero sugar-sweetened beverages per day.
Nutrition Guidelines by Age Group
Toddlers and preschoolers benefit from structured meal and snack times. Offering a variety of foods without pressuring them to eat helps them develop intuitive eating habits. School-age children should be involved in meal planning and preparation to increase their interest in healthy foods. Teenagers need guidance on navigating fast food and managing their own food choices as they gain independence.
Family-Based Approaches
Children learn by observing their parents. Family meals are consistently linked to better nutritional intake and lower BMI in children. It is also important to avoid negative talk about body weight. Focusing on health, energy, and strength rather than weight loss creates a positive environment that supports long-term well-being.
Monitoring Your Child's Growth
Tracking a child's growth is a standard part of pediatric care. Understanding how to monitor these changes helps parents stay informed and proactive.
How Often to Check BMI
For most children, checking BMI during annual well-child visits is sufficient. If a child is actively undergoing lifestyle changes or has a medical condition, a pediatrician may recommend more frequent monitoring. Avoid obsessing over daily or weekly weigh-ins at home, as natural hydration and growth fluctuations can cause unnecessary anxiety.
Tracking Growth Over Time
A single BMI percentile is just a snapshot. The true value lies in the trajectory. A child who has consistently tracked along the 50th percentile since age 3 is likely healthy, even if they cross into the 75th percentile during a growth spurt. However, if a child rapidly crosses upward percentile lines (for example, jumping from the 40th to the 90th percentile in a single year), it warrants a medical evaluation.
Working with Your Pediatrician
Pediatricians use electronic health records to plot a child's height, weight, and BMI on growth charts automatically. During visits, they will discuss these trends with you. Prepare questions about your child's diet, activity levels, and any concerns you have about their growth or eating habits.
When to Consult a Pediatrician
While this calculator provides valuable educational insights, it does not replace professional medical advice. Schedule an appointment with a healthcare provider if you notice any of the following:
- Your child's BMI falls below the 5th percentile or above the 95th percentile.
- Your child experiences rapid, unexplained weight gain or weight loss.
- Your child crosses multiple major percentile lines on their growth chart in a short period.
- You observe signs of disordered eating, such as skipping meals, extreme dieting, or obsessive exercise.
- Your child complains of joint pain, shortness of breath, or chronic fatigue.
A pediatrician can conduct a comprehensive evaluation, order necessary blood tests, and provide a personalized plan tailored to your child's specific developmental needs.
This Kids BMI Calculator and the accompanying information are for educational purposes only. They do not constitute medical advice or a diagnosis. BMI is a screening tool and cannot determine body fatness or overall health. Always consult a qualified pediatrician or healthcare provider for personalized medical advice, diagnosis, and treatment regarding your child's growth and development.
Frequently Asked Questions
How is kids' BMI different from adult BMI?
The mathematical formula for calculating BMI is the same for both groups. The difference lies in the interpretation. Adults use fixed BMI numbers to determine weight categories. Children and teens use BMI percentiles that compare their BMI to other children of the same age and sex, accounting for normal growth and development.
What is a healthy BMI percentile for children?
A healthy weight for children and teens aged 2 to 19 is defined as a BMI between the 5th percentile and the 85th percentile on the CDC growth charts. Any value within this broad range is generally considered healthy, provided the child is growing at a steady rate.
How often should I check my child's BMI?
Checking your child's BMI during their annual well-child visits with a pediatrician is usually sufficient. If you are actively working on lifestyle changes at home, you might check it every 3 to 6 months. Avoid daily or weekly weighing, as normal growth fluctuations can cause unnecessary stress.
Can BMI be used for toddlers under 2?
No. The CDC BMI-for-age growth charts are only validated for children aged 2 to 19. For infants and toddlers under 2, pediatricians use the WHO growth standards and track weight-for-length rather than BMI to assess growth and nutritional status.
What if my child is a competitive athlete?
BMI does not distinguish between muscle mass and fat mass. Highly athletic children or those involved in strength sports may have a high BMI due to increased muscle density. In these cases, a pediatrician may use additional metrics like waist circumference or skinfold measurements to assess body composition accurately.
How do I help my child maintain a healthy weight?
Focus on family-wide healthy habits rather than putting the child on a diet. Encourage the "5-2-1-0" daily routine, eat meals together, limit sugary drinks, and model an active lifestyle. Avoid negative talk about weight or body image, and praise healthy choices rather than focusing on the scale.
When should I be concerned about my child's BMI?
You should consult a pediatrician if your child's BMI is consistently below the 5th percentile or above the 95th percentile. Additionally, rapid changes in growth curves, crossing multiple percentile lines in a single year, or signs of disordered eating warrant professional evaluation.
Can children develop eating disorders?
Yes. Children and adolescents can develop eating disorders such as anorexia nervosa, bulimia nervosa, and binge eating disorder. Warning signs include extreme dietary restriction, obsession with body image, secretive eating habits, and excessive exercise. If you suspect an eating disorder, seek professional help immediately.
What's the difference between BMI and BMI percentile?
BMI is the raw number calculated from weight and height. The BMI percentile is that raw number translated into a ranking compared to a national reference population of the same age and sex. The percentile is the metric used to determine a child's weight category.
At what age should I start tracking my child's BMI?
Pediatricians begin tracking BMI using the CDC growth charts starting at age 2. Before age 2, the World Health Organization (WHO) growth charts are used, which track weight-for-length instead of BMI.
References & Sources
- Centers for Disease Control and Prevention (CDC). About Children's BMI. Retrieved from https://www.cdc.gov/healthyweight/assessing/bmi/childrens_bmi/about_childrens_bmi.html
- Centers for Disease Control and Prevention (CDC). Growth Charts. Retrieved from https://www.cdc.gov/growthcharts/
- American Academy of Pediatrics (AAP). Obesity Prevention and Management. Retrieved from https://www.aap.org/en/patient-care/obesity-prevention-and-management/
- Centers for Disease Control and Prevention (CDC). Causes of Obesity in Children. Retrieved from https://www.cdc.gov/obesity/children/causes.html
- U.S. Department of Agriculture (USDA). Dietary Guidelines for Americans. Retrieved from https://www.dietaryguidelines.gov/
- Centers for Disease Control and Prevention (CDC). Physical Activity Basics for Children. Retrieved from https://www.cdc.gov/physicalactivity/basics/children/index.html
- Centers for Disease Control and Prevention (CDC). Sleep Hygiene. Retrieved from https://www.cdc.gov/sleep/about_sleep/sleep-hygiene.html
- National Heart, Lung, and Blood Institute (NHLBI). Overweight and Obesity. Retrieved from https://www.nhlbi.nih.gov/health/overweight-and-obesity